Weather API and Clothing Algorithm
Tl;dr: My hair gets frizzy so I made a www.weather.com API to help me decide what to do with my hair in the morning.
Growing up, I had a real insignificant problem. I have wavy/curly hair and Virginia is humid. It took me a long time to figure out how to leave my house without looking like one of those unfortunate souls in a Garnier Fructis ad.
In college, my over-exaggerated suffering reached a peak. Walking between classes all day along with a shifting schedule forced me to plan such decisions in advance every morning.
My first priority was hair. I hated spending the time in the morning blow drying and straightening it (to avoid having wet hair for hours) only to have it turn into a mess immediately. So I started investigating what conditions were acceptable for straightening and which were not.
I would look at the forecast, either straighten or leave curly, then observe the outcome. If I straightened and it got frizzy, that was a failure and I would try again the next day.
Today, I recognize this process as a form of reinforcement learning. At the time I did not possess the vocabulary to name it. I simply referred to the final product as my little hair algorithm.
Eventually, I did the same thing with my whole outfit. I found the thresholds temperatures for switching between pants and shorts, short-sleeves or long-sleeves, and various winter jackets.
It should be noted that I am a winter child and can't stand being too warm.
This project visualizes my algorithm as a map of major cities in the US and Europe, which are color-coded by a hair straightening indicator. Each node contains additional information scraped from www.weather.com's 10 day forecast that I personally can use to plan trips.
Weather Forecast Folium Map

This is the final result using the data scraped from the 10 day forecast from www.weather.com. The final function to create this map takes a single date as input, but the program builds a complete dataframe of cities and their forecasts for the next 20 or so days. I'll walk through how to build the 10 day forecast map since the hourly forecast map pretty much follows the same routine.
10 Day Forecast API
To begin, I created an input list of cities and their URL extensions and saved it into a csv. I found this to be the easiest way to do get the website addresses despite the manual heavy lifting to go and find all of the extensions. I'm very open to better ways to do this.


Now that I have the list of locations I am interested in, we can start doing the fun stuff. We will begin with collecting the 10 day forecast, which actually contains more than 10 days of forecasted weather data.
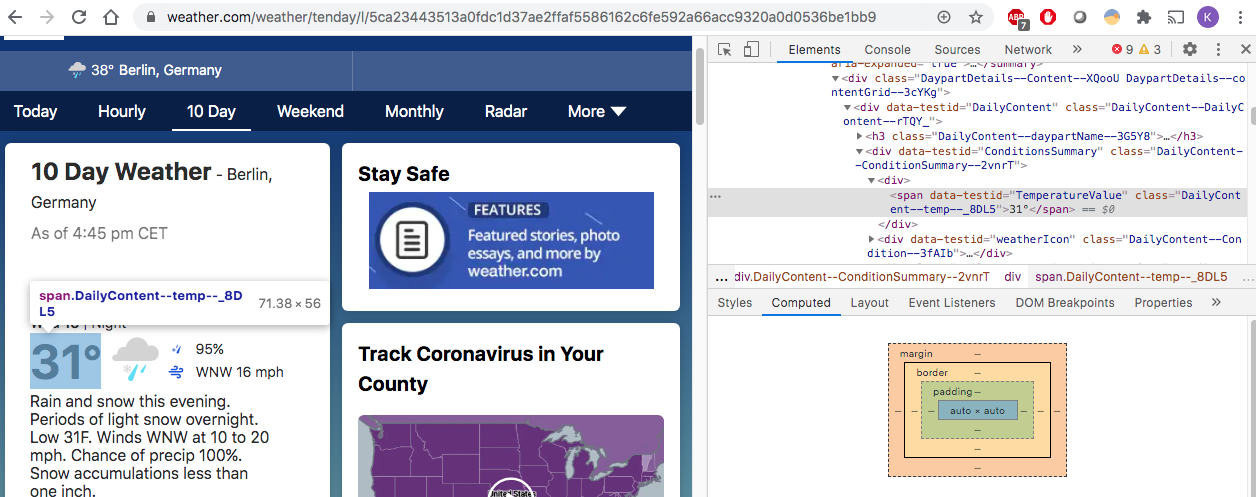
The trick with pulling data from the website is looking at the html of the webpage by right clicking anywhere on the site and selecting “inspect.” This will allow you to highlight information you want to pull and see the corresponding class names.
import pandas as pd
import numpy as np
from bs4 import BeautifulSoup
import requests

def get_10day_forecast(city_name, locations_df):

    ext = locations_df.loc[city_name][0] #look up the url of the city
    page = requests.get("https://weather.com/weather/tenday/l/" + ext)

    content = page.content
    soup = BeautifulSoup(content,"html.parser")
    table = soup.find_all("details",{'data-testid':"ExpandedDetailsCard"})

    l = []
    for j,i in enumerate(table):
        w = {}
        try:
            if j == 0:
                w['lo_temp'] = i.find_all("span",{"data-testid":"TemperatureValue"})[0].text
            else:
                w['lo_temp'] = i.find_all("span",{"data-testid":"TemperatureValue"})[1].text
                w["day"] = i.find_all("h3")[0].text.split('|')[0]
                w["hi_temp"] = i.find_all("span",{"data-testid":"TemperatureValue"})[0].text
                w['precip'] = i.find_all("span",{"data-testid":"PercentageValue"})[0].text
                w['wind'] = i.find_all("span",{"data-testid":"Wind"})[0].text
                w['humidity'] = i.find_all("li",{"data-testid":"HumiditySection"})[0].text.split('Humidity')[1]
            except:
                w["day"]="None"
                w["hi_temp"]="None"
                w["lo_temp"]="None"
                w["precip"]="None"
                w["wind"]="None"
                w["humidity"]="None"
        l.append(w)
    df = pd.DataFrame(l)
return df
I am using Beautifulsoup to pull data from weather.com. I wrote a function that takes a city name and the location/URL input file as parameters. The function looks up the URL based on the city's name and goes to that city's page on www.weather.com. (I set it up like this so that I could use this function in a for loop for all the cities but also keep it modular incase I wanted just one city's weather data in the future.)
The output is a pandas dataframe that contains the city, the day (the format for the day is funky so we have to tackle that in a separate function), the high temperature, the low temperature, precipitation percentage, wind speed, and that sweet sweet humidity percentage for the hair.
Now that we have a function that will output the details of a forecast, we can use that in a for loop to build a larger dataframe containing every city's weather details to later include in our folium map.
tend_file_path = 'forecast_files/10_day_forecasts.csv'
def get_10day_df(locations_df):
    # Get 10 day weather forecast for cities in locations_df
    weather_10day_df = pd.DataFrame()
    city_list = locations_df.reset_index().city
    temp = []
    start = True
    timeout = time.time() + 60 * 3   # 3 minutes from now

    while len(city_list) > 0 and time.time() < timeout:
        temp = []
        for idx in city_list:
            df = get_10day_forecast(idx, locations_df)
            if len(df) == 0:
                temp = temp + [idx]
            df['city'] = idx
            weather_10day_df = weather_10day_df.append(df, sort=True)
        city_list = temp
        start = False
        if time.time() > timeout: # break while loop if stalled
            break

    weather_10day_df = weather_10day_df.reset_index(drop=True)

    weather_10day_df.to_csv(tend_file_path) # Save file to csv
    print('done')
    return weather_10day_df
This looks a bit involved but all I'm doing is setting up some checks to make sure the function doesn't stall out or skip over any locations if on the first try it can't find the page, which sometimes happens. Not sure why, if anyone knows what's going on, I would love to hear about a better solution!
Post Processing
weather_df['humidity'] = weather_df['humidity'].apply(
lambda x: int(x.split('%')[0]))

weather_df['wind'] = weather_df['wind'].apply(
lambda x: int(x.split(' ')[1]))

weather_df['precip'] = weather_df['precip'].apply(
lambda x: int(x.split('%')[0]))

weather_df['lo_temp'] = weather_df['lo_temp'].apply(
lambda x: int(x.split('°')[0]) if '--' not in x
else np.nan)

weather_df['hi_temp'] = weather_df.apply(
lambda x: int(x['hi_temp'].split('°')[0]) if '--' not in x['hi_temp']
else x['lo_temp'], axis = 1)

weather_df.dropna(inplace = True)
All of the data we scraped is in string form. We want to extract the numerical values of each field so then we can apply the actual decision-making algorithm on them. Since all of my thresholds are personalized to me, I'll share just one example:
weather_df['hair']  = weather_df.apply(
lambda x: "Don't straighten" if x.humidity > 65# or hair_description_bool else "Straighten", axis = 1)
In the end, I have one dataframe that contains all of my cities, their weather details in the correct format, and the subsequent decisions for my hair, pants, jackets, and shoes.
Getting the Correct Date Format
Python's date.time package. My old nemesis. Weather.com, I'm sure, stores the actual date in a usable format, but I could only find the 'day' of a forecast, which comes in the form 'DOW DD'. So now we have to translate the day of the week to a format that I can use.
def tenday_date_col(date):
    x = date[:-1]
    today = datetime.now()

    if x in ('Today', 'Tonight'):
        datetime_object = today

    else:
        d = int(datetime.strptime('{}'.format(x), "%a %d").strftime('%d'))
        if today.day > d:
            m = max((today.month + 1) % 13, 1)
        else:
            m = today.month
        y = today.year
        datetime_object = datetime.strptime('{} {} {}'.format(d, m, y), "%d %m %Y")

    return datetime_object.strftime('%m-%d-%Y')
Note, sometimes weather.com makes my life difficult by using “Tonight” or “Today” for the first forecast row, so we have to account for that with the first if statement. Also, to infer the correct month, we have to check if the date number they give us is smaller than today's day number. In that case, we need to add 1 to the month number. To keep us honest using a 12 month calendar, we take mod 13 of this number. In the end, we get a string in the form of 'MM-DD-YYY'. We can work with that.
Most of my calculations are pandas dataframe operations, often with df.apply, but vectorized when possible. This date function is applied to my dataframe collected from the get_10day_df function output.
print('   Formatting date column...')
tenday_df['date'] = tenday_df.apply(lambda x: tenday_date_col(x.day), axis = 1)
Geolocation using a Google API Key
To pull geolocation data, you need to have a Google API Key
import googlemaps
from bs4 import BeautifulSoup
import requests

gmaps = googlemaps.Client(key='YOURKEYHERE')
coordinates_file_path = '../inputs/coordinates.csv'

def get_coordinates(city):
    lat = []
    lng = []
    geocode_result = gmaps.geocode(city)
    lat.append(geocode_result[0]['geometry']['location']['lat'])
    lng.append(geocode_result[0]['geometry']['location']['lng'])

    return lat, lng

def get_coordinates_df(locations_df):

    print('\n\nLooking up City Coordinates...')
    coordinates = pd.DataFrame(columns=['city', 'lat', 'lng'])
    cities = locations_df.reset_index().city.unique()
    for i in cities:
        lat, lng = get_coordinates(i)
        row = pd.DataFrame({"city" : i, "lat": lat, "lng" : lng})
        coordinates = coordinates.append(row)
    coordinates.reset_index(inplace = True, drop = True)

    coordinates.to_csv(coordinates_file_path)
    print('done\nCoordinates file saved to {}'.format(coordinates_file_path))
    return coordinates
Now I have a file that contains the coordinates of each city in my list. I can join this list onto my larger forecast dataframe on city name, and finally, we have all of the pieces needed to build our map.
Building the Folium Map with HTML Formatting
For this, we have two functions. One is an html formatting function. The other actually builds our folium map.
Packages/
import folium
import pandas.io.formats.style
from IPython.display import HTML
from folium import FeatureGroup, LayerControl, Map, Marker
import os
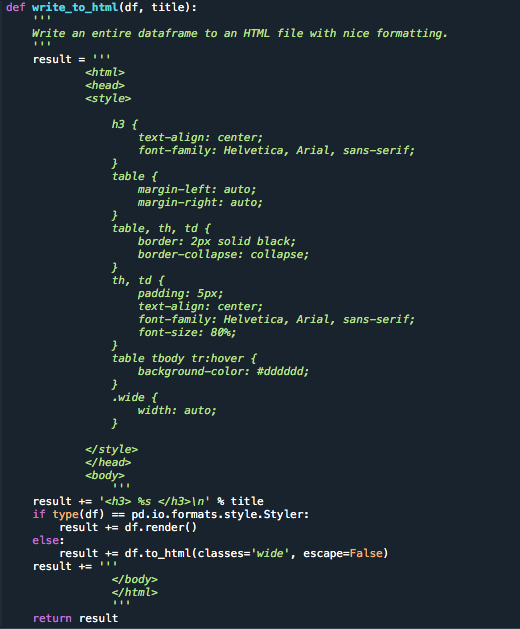
This function takes the full weather forecast plus decisions plus lats and longs dataframe along with a specific date to create a map of each city from out input for that specified date.
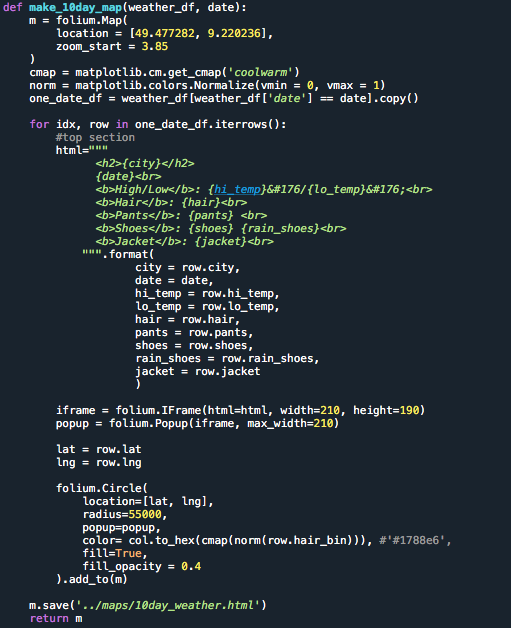
And there you have it. I followed the same process to create the hourly forecast map, which I like because it is handy for planning out my day.
Hourly Forecast Map
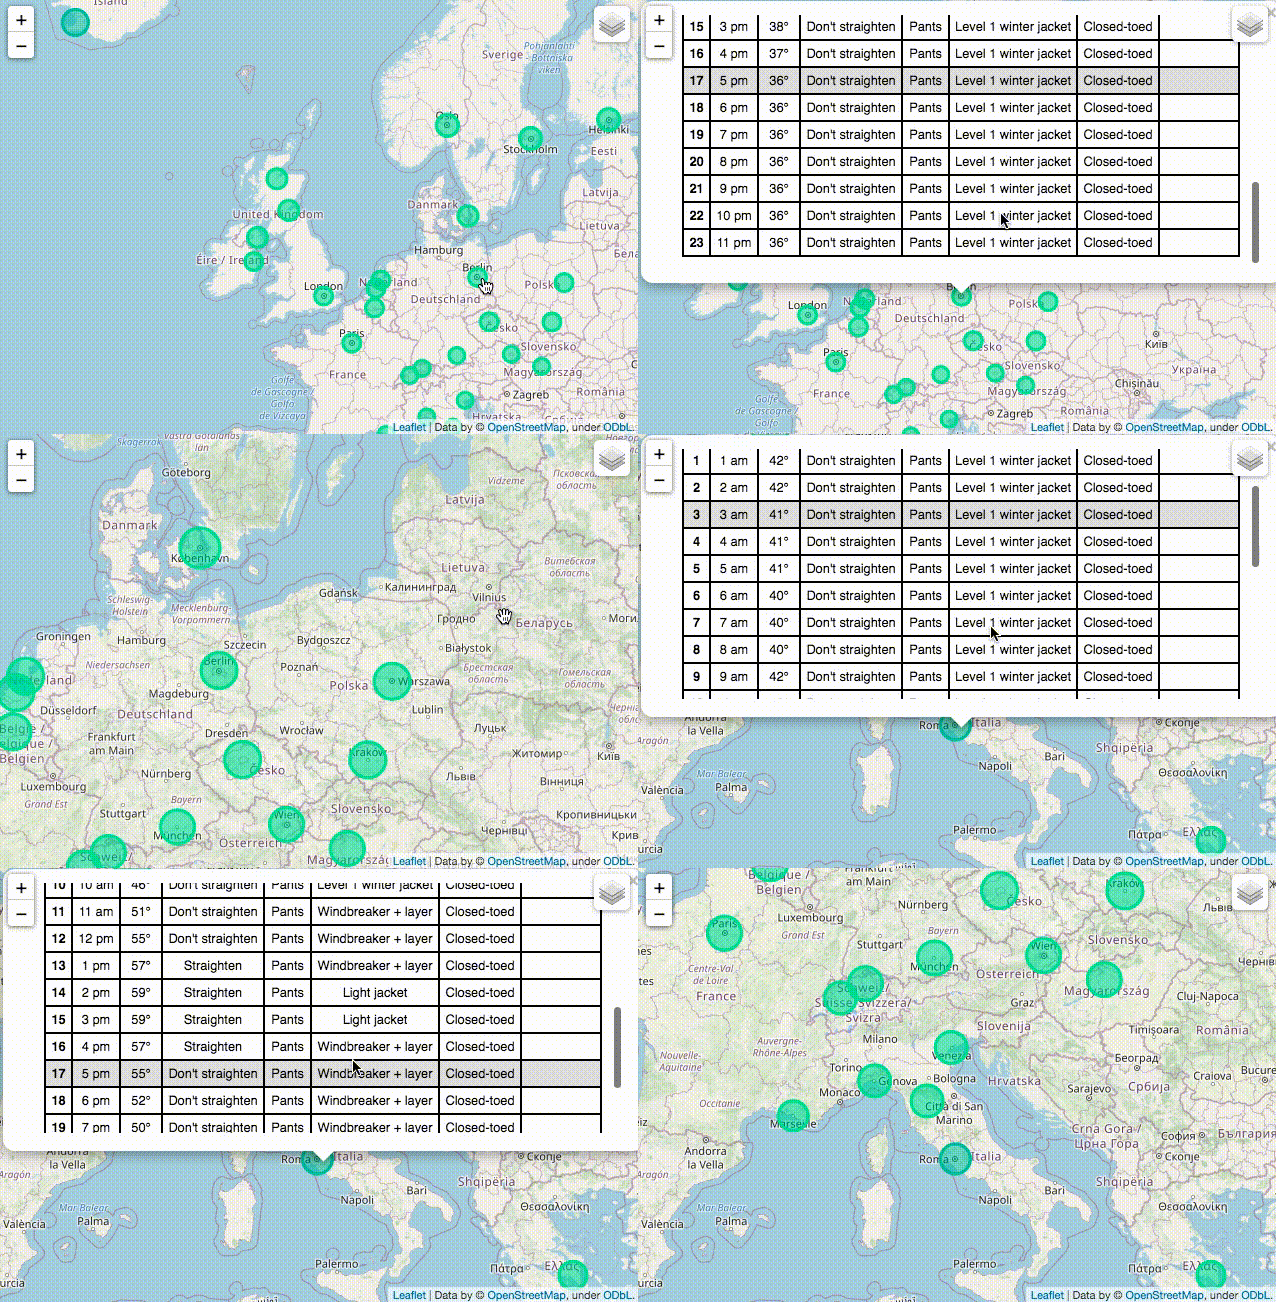
Packing a Suitcase
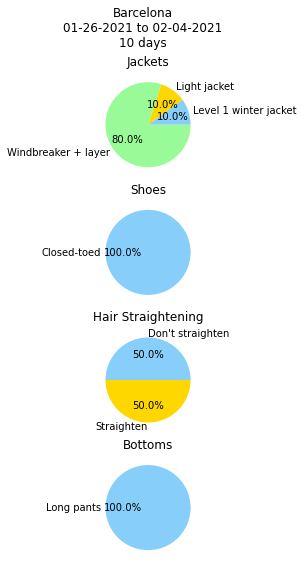
Now that we worked so hard to get the forecasts for the next couple weeks, we should use the data. Packing a suitcase is a nightmare for me; I end up bringing all of my clothes regardless of the trip duration or time of year. This is my attempt to add a little structure to this process.
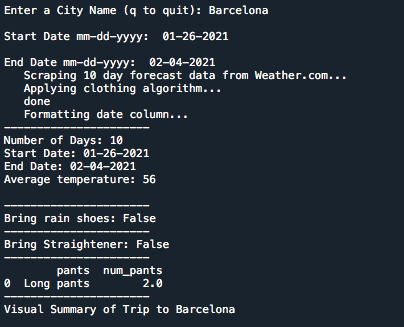
I set up a small runfile that builds the 10 day forecast dataset then takes input from the user: name of destination city, trip start date, and trip end date. Here is an example run using Barcelona as a destination (I can dream):
In the future, I want to refine this part and turn it into a proper knapsack optimization :)